
The Taylor Advisors Performance Snapshot is an in depth report on your institution's
margin, yield, and costs in comparison to UBPR and State Peer Averages.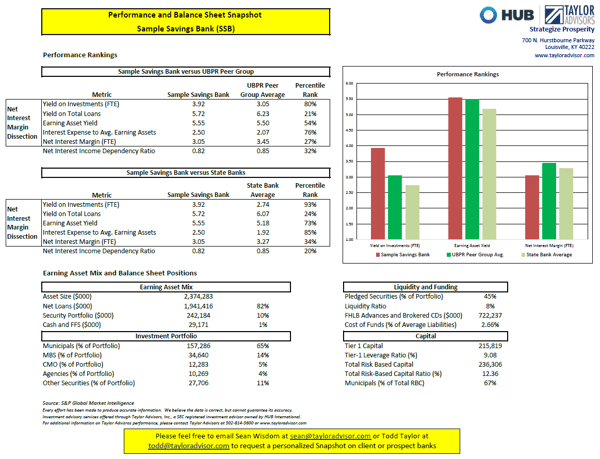
margin, yield, and costs in comparison to UBPR and State Peer Averages.
As you’ll see, the graph on the top right shows performance data about the institution (red) and compares it to other institutions in its UBPR peer group and its home state (green).
The Net Interest Margin Dissection to the left shows the numbers that correspond to the graph and also ranks the institution versus its peer group, approximating the UBPR report. Below that is additional balance sheet information about the institution.